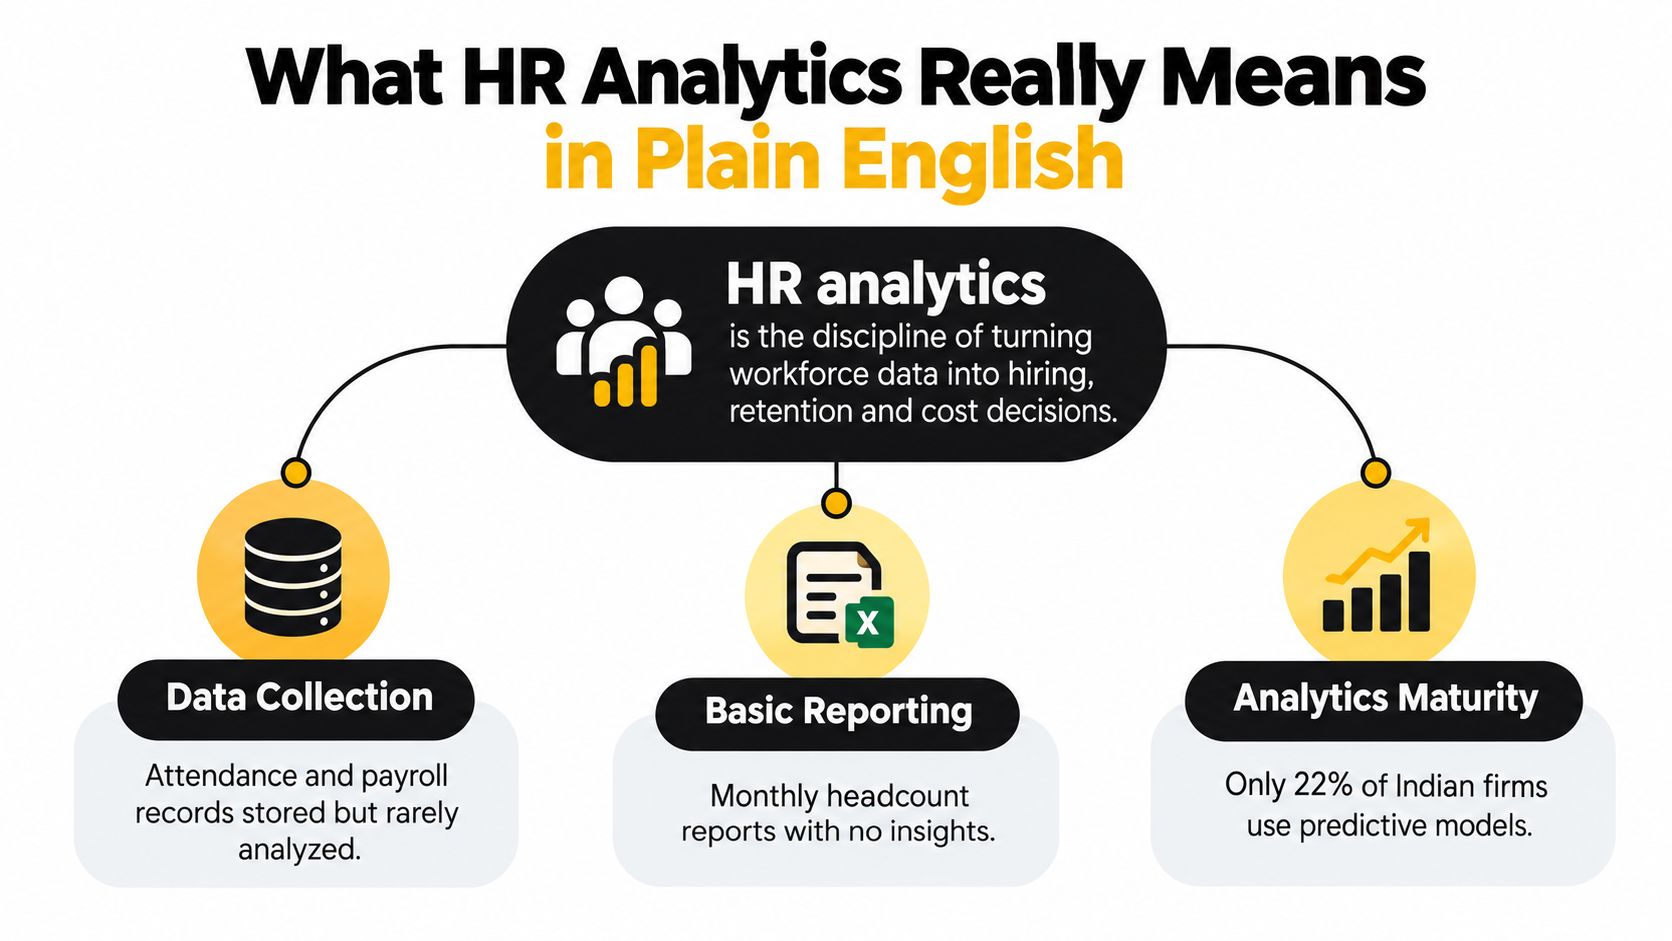
HR analytics is the discipline of turning workforce data into hiring, retention and cost decisions. In India, 43% of organisations operate at advanced maturity levels, while more than 70% still rely on static reporting approaches according to Deloitte's India-focused people analytics findings.
So what are HR analytics if many HR teams already produce headcount reports, payroll summaries and attrition charts? The difference is not whether your organisation has data. Most organisations do. The difference is whether leaders use that data to decide which roles to hire, why employees leave, where costs are rising and what action should happen next.
Think of HR analytics as the dashboard of a company's workforce. A car dashboard shows speed and fuel level. Warning lights point to a problem. GPS estimates arrival time, while route suggestions help the driver choose a better path. HR reporting tells you what happened. HR analytics helps you understand the signal, estimate what may happen next and choose a response.
India's adoption has developed unevenly. One academic evidence stream reported that only 35% of Indian organisations had implemented HR analytics in 2013, compared with 60% in the United States. The same evidence stream cites later adoption figures of 26% by 2020 in a KPMG-referenced study and 20% in a 2021 Oracle survey, illustrating that HR analytics has grown as a management capability rather than arriving as a finished software category as documented in this Indian academic study.
The practical lesson is simple. You don't need a model on day one. You need a reliable answer to a business question, followed by a repeatable decision process.
Table of Contents
- What HR Analytics Really Means in Plain English
- The Four Types Every Leader Should Know
- Key HR Metrics Worth Tracking First
- Where the Data Actually Comes From
- Real Use Cases in Recruiting, Retention and Planning
- A Practical Roadmap to Get Started
- Where AI Interviews Fit and Common Pitfalls
- Key Takeaways and Your First Step
What HR Analytics Really Means in Plain English
What should an HR leader decide after seeing a workforce number? HR analytics turns workforce information into a business decision, whether that means choosing whom to hire, investigating retention, controlling costs, meeting compliance needs or improving employee development. A headcount report becomes analytics when someone uses it to examine a pattern and change an action.
Suppose a department has fewer employees than planned. The number identifies a gap, but the next question determines the response. Did offers fail to convert? Are candidates waiting too long for interviews? Did experienced employees leave after a manager change? Are payroll and attendance records using different employee identifiers? Each answer points to a different intervention, from fixing the interview process to reviewing management practices or cleaning the underlying data.
The dashboard analogy
A car dashboard offers a useful comparison:
- Gauges show the current state. Headcount, tenure, overtime and payroll records describe what exists.
- Warning lights flag pressure. Rising regrettable attrition or a stalled hiring funnel deserves attention.
- GPS estimates the route ahead. A model can identify patterns associated with future hiring or retention risk.
- Route guidance supports action. Leaders can adjust recruitment stages, manager support, career paths or workforce plans.
Traditional HR reporting often stops at the gauges. It produces regular figures, frequently in spreadsheets, but leaves leaders to interpret their meaning. People analytics connects each figure to a business question, a possible cause and a decision.
Practical rule: A dashboard is valuable only when a named person knows which decision it should change.
Deloitte's India findings show the gap between collecting information and using it in management. More than 70% of Indian organisations still rely on static reporting approaches, even though 43% operate at advanced maturity levels Deloitte reports. The figures suggest that organisations build this capability in stages. They may have relevant information without yet making analysis part of regular management routines.
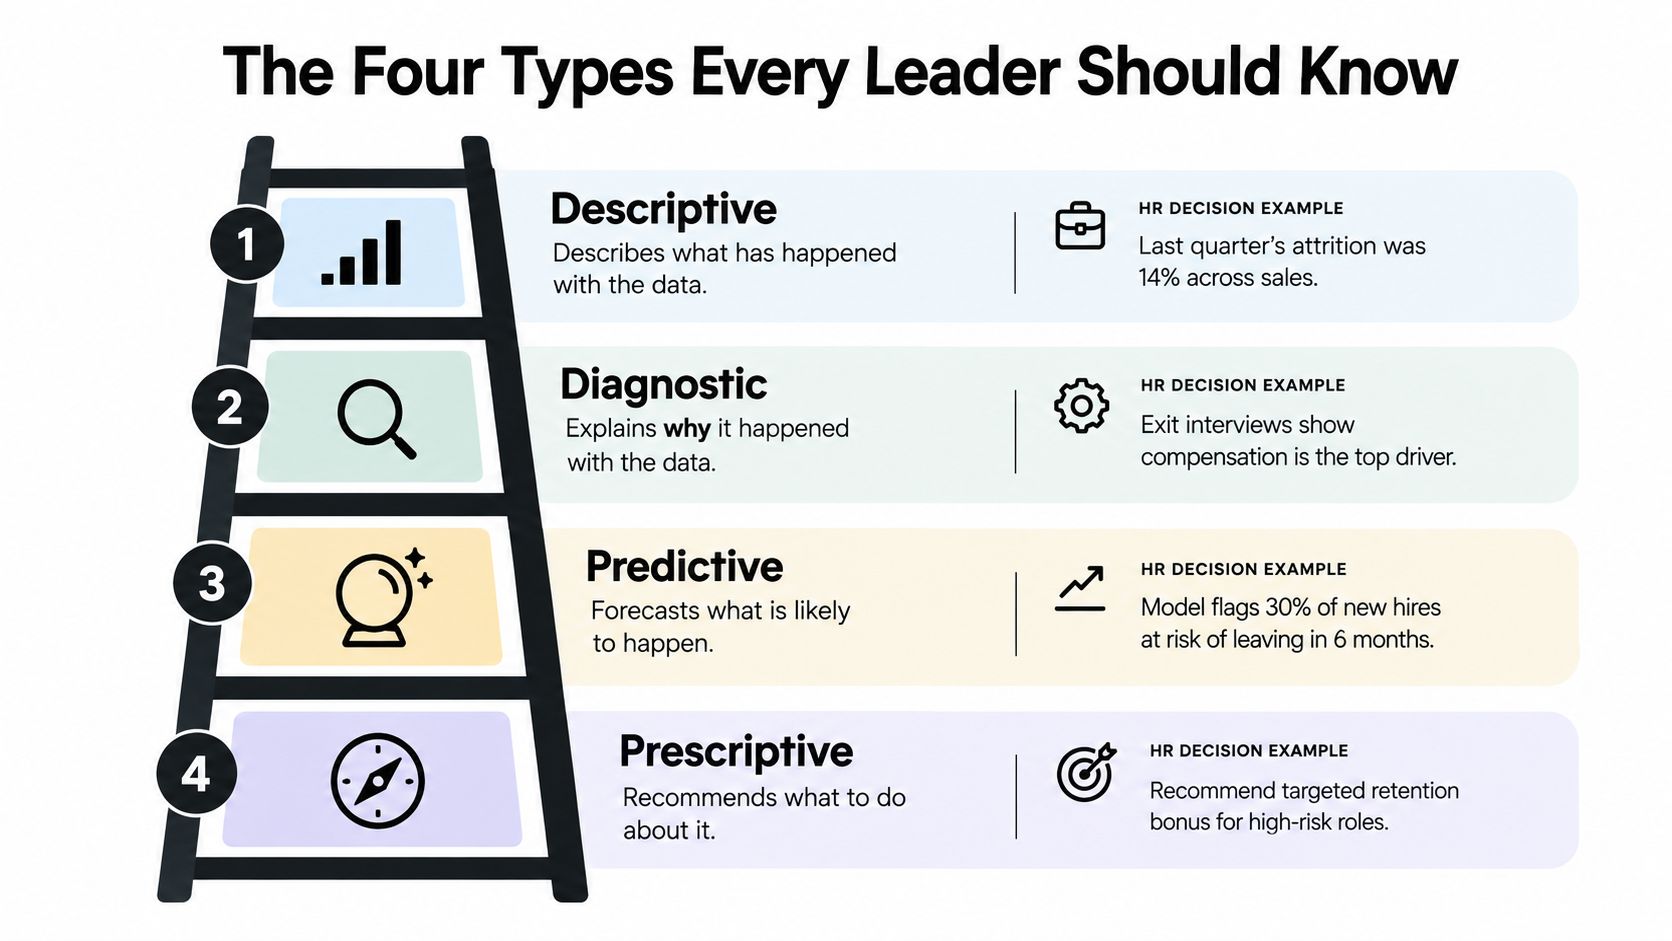
The four familiar analytics types work as rungs on one ladder. Descriptive analytics establishes the facts. Diagnostic analytics examines why they occurred. Predictive analytics estimates what may happen next. Prescriptive analytics links the insight to an action. For an HR leader in India, that sequence can support decisions about hiring capacity, retention interventions and workforce planning. AI-led interview data can provide an early, structured input into the stack, before later analysis combines it with broader workforce information. Each rung depends on the quality of the one below it.
The Four Types Every Leader Should Know
A founder doesn't need four separate analytics programmes. They need one chain of reasoning that moves from evidence to action. The four types provide that chain.
Descriptive analytics tells you what happened
This is the foundation. It summarises past or current activity, such as headcount by location, hiring activity, absenteeism or attrition by department. A report might state that sales attrition was 14% last quarter, but that figure alone doesn't explain whether the number is concerning or what caused it.
The decision for an HR leader is whether a pattern deserves investigation. Without consistent descriptive reporting, leaders argue about whose spreadsheet is correct instead of discussing the workforce issue.
Diagnostic analytics asks why
Diagnostic analysis breaks a result into relevant dimensions. The HR team might compare attrition by tenure, manager, compensation band, location, role and performance history. Suppose the analysis links the sales increase to a compensation gap in a specific band. That is a working explanation, not merely a restatement of the outcome.
The decision is where to intervene. The answer could involve pay structure, manager coaching, internal mobility or workload. Diagnostic analysis narrows the field before leaders spend money or alter policy.
Predictive analytics estimates what may happen
Predictive analytics uses historical patterns to identify possible future outcomes. A model might flag engineers whose combination of tenure, manager changes, compensation position and engagement signals resembles previous leavers. The output is a risk signal, not a verdict.
The decision is where to prepare. A CHRO might ask managers to review career development, workload or role expectations with relevant employees. Managers should never treat a risk score as proof that someone intends to resign.
Prescriptive analytics recommends what to do
Prescriptive analytics moves from likelihood to response. If a role shows retention risk, the recommendation might combine a compensation review, a clearer career path and structured stay interviews. The recommendation must still pass a human review, because context often sits outside the dataset.
The decision is which intervention to test and how to monitor it. A good prescriptive output names the owner, the action, the timing and the result to review.
Most organisations begin with descriptive reporting. That's not a weakness. It is the necessary base for more advanced work. If job titles aren't standardised, employee identifiers don't match and exit reasons are recorded inconsistently, a predictive model produces a more complicated version of a weak report.
Key HR Metrics Worth Tracking First
Which workforce decision needs clearer evidence first? Start there, rather than building a dashboard around every measure a vendor offers. A useful starter set covers hiring, retention, performance and compliance, with no more than eight metrics at the beginning.
| Domain | Metric | Question it answers |
|---|---|---|
| Hiring | Time to hire | Where does the hiring process slow down? |
| Hiring | Cost per hire | What does each completed hire cost? |
| Hiring | Quality of hire | Are new employees meeting the role's expectations? |
| Retention | Regrettable attrition | Which valued employees are leaving? |
| Retention | Tenure-based attrition | At what stage do employees tend to exit? |
| Performance | Goal achievement | Are teams delivering against agreed objectives? |
| Performance | Manager effectiveness score | Which managers need support to lead better? |
| Compliance | Grievance resolution time | How quickly are employee concerns being addressed? |
Choose measures by decision
Hiring metrics help a recruitment leader identify whether the issue sits in sourcing, process design or candidate experience. Time to hire tracks the elapsed period from the agreed starting point to accepted hiring completion. Cost per hire gathers the recruitment costs assigned to each completed hire. Quality of hire should connect selection evidence with later role performance, while offer acceptance rate can indicate concerns about compensation, communication or the candidate experience.
For an India-based hiring team, these measures support a practical decision: should the organisation add recruiters, change sourcing channels or fix delays between interview stages? AI-led interview data can provide an early input, such as structured responses and evaluation patterns, but it should be reviewed alongside later job performance rather than treated as a final answer.
Retention metrics require more detail than one overall attrition figure. Regrettable attrition separates the loss of valued employees from expected movement. Tenure-based attrition shows whether exits cluster soon after joining, during a promotion wait or after employees gain experience. Internal mobility rate adds another business question: can employees find their next opportunity inside the organisation?
Keep performance and compliance connected
Performance measures should pair outcomes with context. Goal achievement shows delivery, while manager effectiveness scores and skill coverage help explain whether teams have the support and capability to deliver. eNPS can provide a sentiment signal, but it cannot diagnose the cause by itself.
Compliance measures protect operational trust. Track grievance resolution time, training completion and POSH case closure reporting with strict access controls and careful interpretation. In India, practical HR analytics can also connect headcount with PF challan summary, ESI contributor count, TDS month-on-month, gratuity provisioning by tenure and state-wise labour welfare fund reporting as described in an India HR analytics market overview. Select the measures that support a decision your HR team must make now, then define the owner, review period and action attached to each one.
Where the Data Actually Comes From
What happens when an HR leader in India needs one reliable answer, but the relevant records sit in five systems? HR data works like a company's plumbing. Each system carries a different flow, and analytics becomes useful only when the pipes connect without mixing identities or definitions.
| Data Source | Typical Data Captured | Decisions It Feeds |
|---|---|---|
| HRIS | Headcount, tenure, demographics and employment status | Workforce reporting, compliance and organisation design |
| Payroll | Salary, deductions, overtime and benefits | Cost control, pay analysis and attrition cost |
| ATS | Applications, stages, interview outcomes and offers | Sourcing, recruiter capacity and time to hire |
| LMS | Courses, certifications, learning hours and skill activity | Capability planning and development priorities |
| Engagement tools | Pulse responses, sentiment and survey themes | Manager support, experience and retention investigation |
Give every system a defined job
The HRIS should be the system of record for employee identity and employment status. Payroll is the better source for compensation, overtime and statutory cost signals. The ATS covers candidate flow, while the LMS supports learning and capability questions.
Engagement tools provide a different kind of evidence. Survey responses can show how employees experience management or workload, yet a low score needs context. It may reflect a temporary event, a local manager issue or a broader organisational concern.
Candidate data needs the same care. A resume parser turns an unstructured document into structured fields, but the organisation must still check how those fields are interpreted and used. See this guide to what parse resume means for a practical explanation of that process.
Connect data in manageable increments
API-ready platforms are usually easier to connect to a warehouse or business intelligence layer than spreadsheets emailed each month. A mid-sized organisation does not need a large ETL programme at the outset. Start with one business decision, connect only the systems that inform it and document shared fields, such as employee ID, joining date and department.
For an India-based HR team, monthly reconciliation may require employee master records, payroll ledgers, attendance logs and compliance registers to agree before reporting begins. Keep exports in usable formats such as PDF, Excel or CSV, and connect them to BI tools only where the process can be maintained. As outlined in the India HR analytics market description, reporting may also involve API connections and recurring compliance workflows as outlined in the India HR analytics market description.
The best architecture is the one people can maintain. That gives each analytics layer a dependable input, from an AI-assisted interview record at the start of the hiring journey to workforce decisions made later from connected employee data.
Real Use Cases in Recruiting, Retention and Planning
HR analytics earns credibility when it changes a real operating decision. Three use cases usually make the value visible quickly: recruiting, retention and workforce planning.
Recruiting reveals the bottleneck
A recruitment funnel contains more information than the final hiring count. Compare candidate flow by source, recruiter, role, interview stage and hiring manager. If candidates move quickly through sourcing and screening but wait during manager review, the bottleneck is operational rather than a shortage of applicants.
The action might be to set review ownership, simplify scheduling or clarify the interview scorecard. The board-level measure remains time to hire, but the analysis tells leaders which part of the process deserves attention.
Retention changes the timing of intervention
Overall attrition can hide concentrated risk. Slice the data by joining date, manager, location, compensation position, role and engagement signals. A cluster may show that employees in a particular tenure band or role face a recurring issue, such as limited progression or inconsistent workload.
That insight lets HR hold a focused conversation before resignation rather than conduct a general retention campaign after people leave. For a useful distinction between total movement and the loss of employees the organisation most wants to keep, see this explanation of attrition in HR. The board-level measure is regrettable attrition rate, supported by a documented view of the roles and groups affected.
Planning replaces annual argument with evidence
Workforce planning joins headcount, productivity, business pipeline and skill requirements. Leaders can then estimate where hiring demand may emerge by skill and location across upcoming planning cycles, instead of relying only on an annual headcount negotiation.
The output isn't a promise that the forecast will be correct. It is a transparent set of assumptions that finance, business and HR can review together. The board-level measure is forecast variance versus plan, which shows whether workforce assumptions remain close enough to support operating decisions.
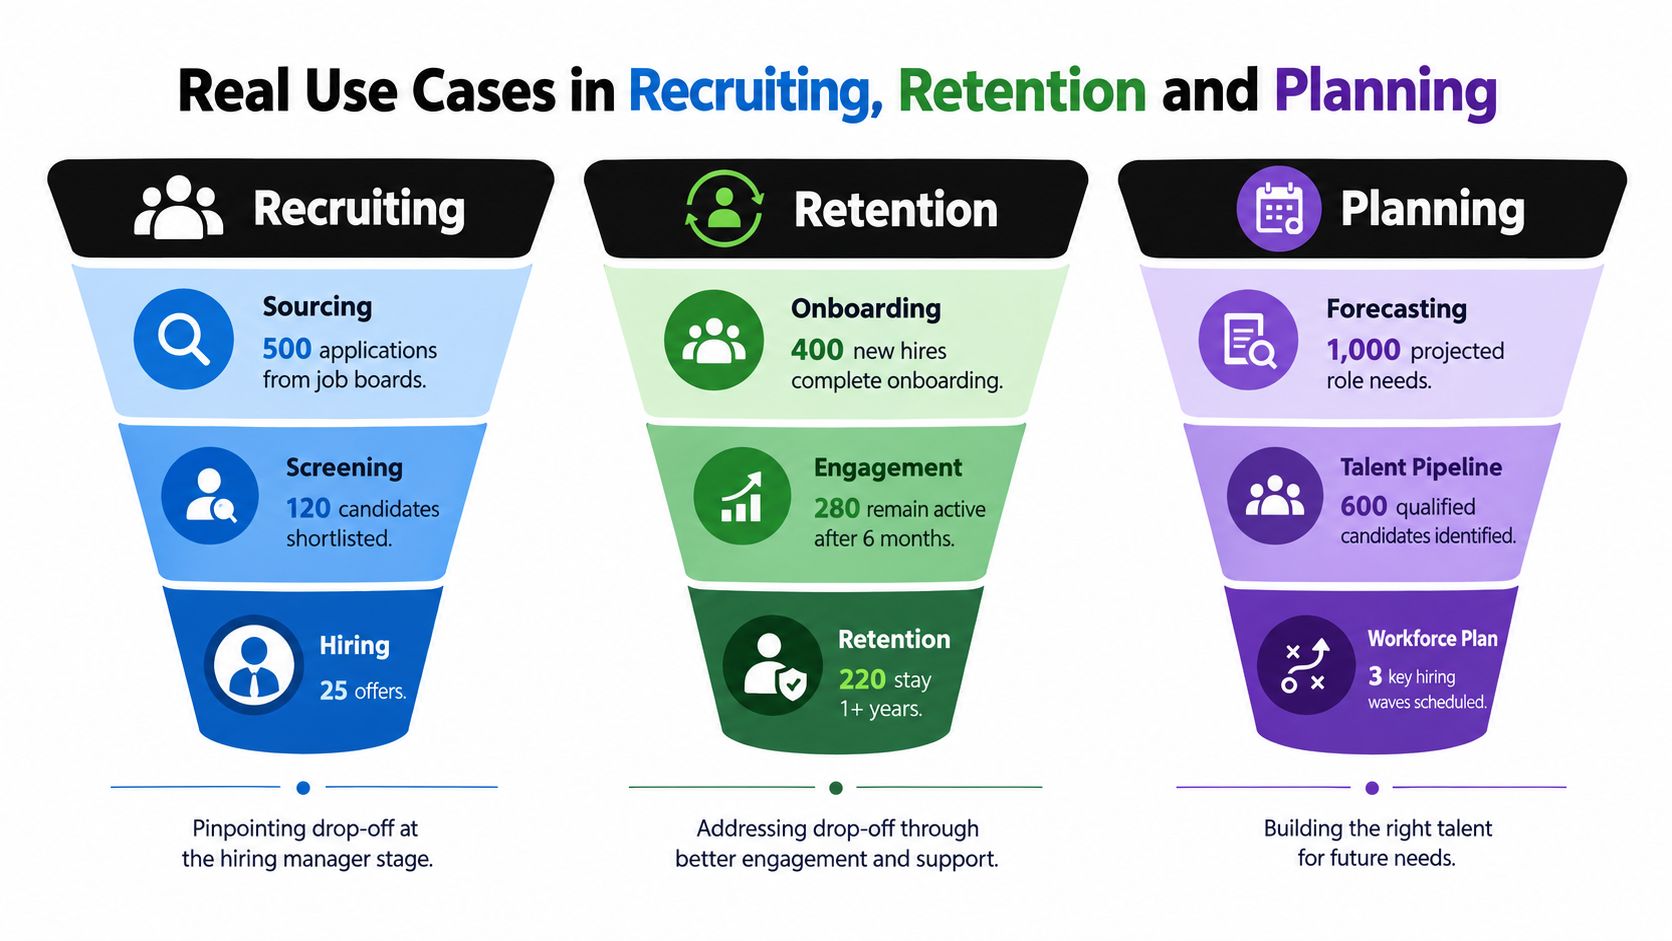
The common thread is not a particular dashboard. It is the movement from a broad result to a precise owner, intervention and review metric.
A Practical Roadmap to Get Started
Analytics programmes fail when teams attempt to connect every system, answer every question and build predictive models at once. A mid-sized Indian company can create more momentum by sequencing the work around one decision and one pilot.
Five steps for a focused rollout
Audit what already exists. List the fields available in the HRIS, payroll and ATS. Check whether names, job titles, joining dates, department labels and employee identifiers match. Mark missing fields rather than hiding the gaps.
Choose one business question. Ask a question a leader must answer soon, such as whether regrettable attrition is concentrated in a particular role or whether hiring delays sit with sourcing or approvals. Define the metric before building the dashboard.
Unify the minimum data. Bring together only the records required for that question. A controlled spreadsheet can be enough for an initial pilot, provided someone owns the definitions and change history.
Pilot with one business unit. Run the analysis for a defined period, compare the insight with manager context and record what decision changed. The pilot should test the operating habit, not just the visual design.
Document governance before scaling. State who can edit source data, who can view sensitive fields, how corrections are approved and how long outputs are retained. Then add the next use case.
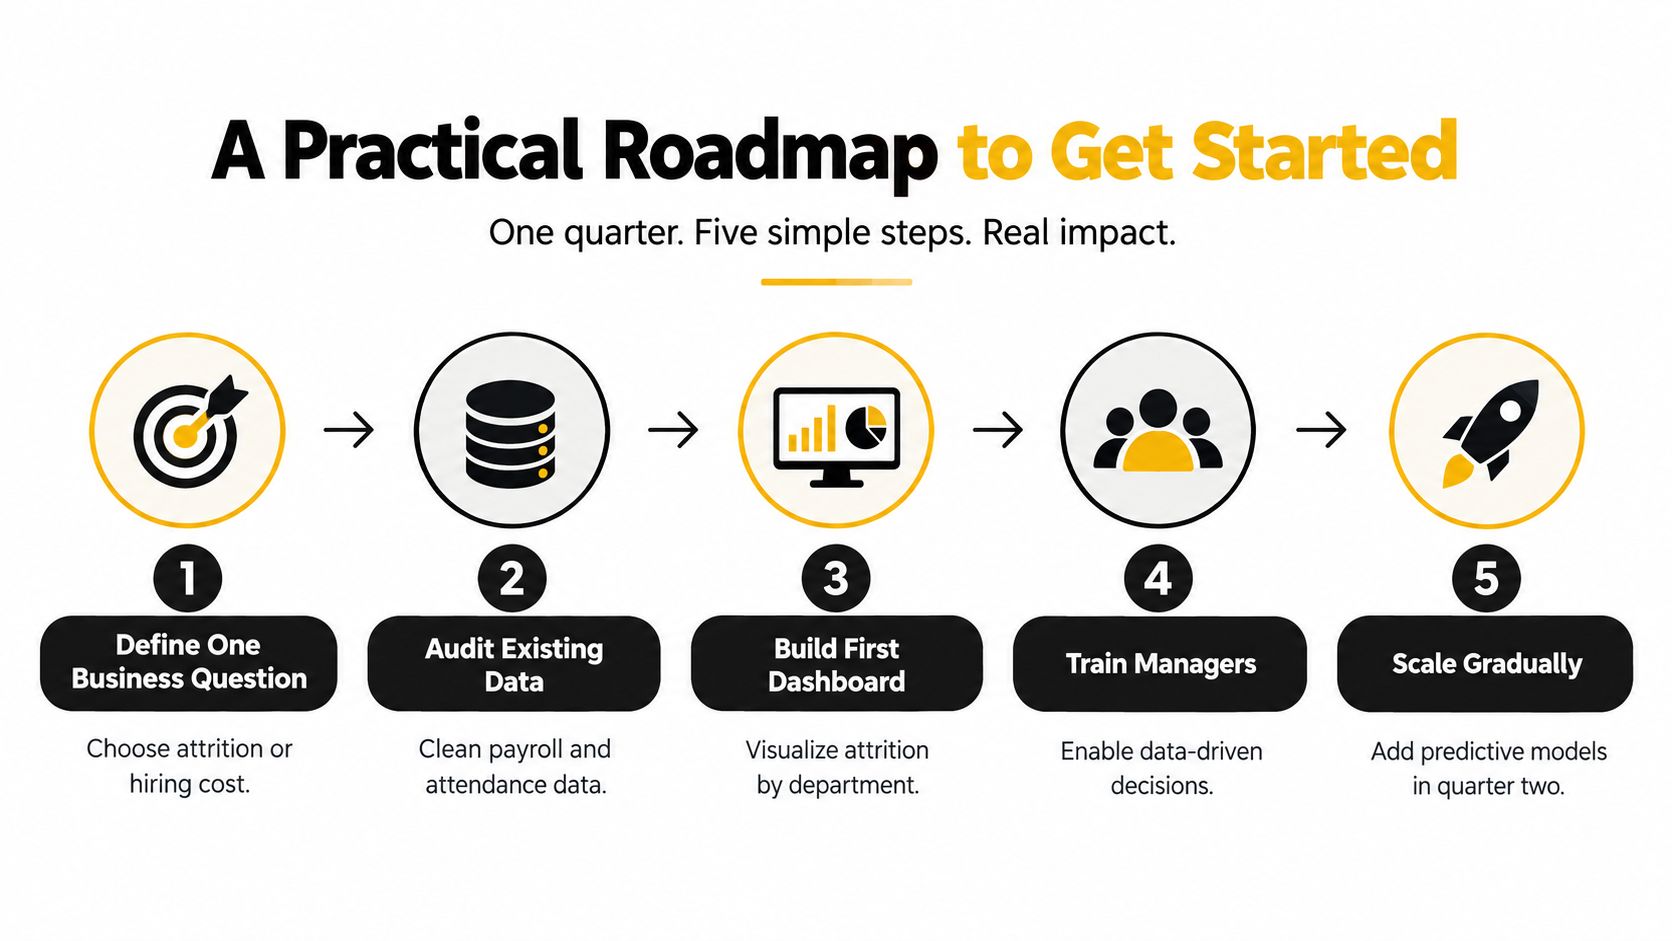
A pilot should produce more than a presentation. It should leave behind a shared metric definition, a trusted data set, a named decision owner and a review rhythm. If managers don't change a hiring, retention or planning action, the programme hasn't yet created business value.
Structured selection can provide a cleaner starting point for that work. Before adopting a platform, compare candidate assessment tools against the role requirements, evidence captured and governance controls rather than choosing on dashboard appearance alone.
Where AI Interviews Fit and Common Pitfalls
AI-led interviews can sit at the earliest point in the analytics stack, before a candidate becomes an employee record. A structured phone screen, first-round interview or coding assessment can capture consistent competency evidence, interview transcripts and comparable evaluation signals. Those inputs can later support quality-of-hire analysis, provided the organisation defines what success means after joining.
This timing matters because later HR data is often messy. Job titles may vary between teams. Attendance entries may be manual. ATS exports may not synchronise with HRIS records. If those inconsistencies enter a model, the model can identify administrative habits rather than meaningful workforce patterns.
Treat interview data as evidence, not a verdict
An AI interview should support a structured process, not remove human accountability. Hiring managers still need to review role relevance, accommodations, candidate context and potential bias. A transcript or score can organise evidence, but it shouldn't become an automatic rejection without review.
Leaders should also separate prediction from causation. If a group shows higher attrition after a certain interview score, that association may reflect role allocation, manager assignment or onboarding quality. The score itself may not cause the outcome.
Governance questions to settle first
Before scaling an AI-led interview process, answer these questions:
- Purpose: What hiring or workforce decision will the data support?
- Consent: Has the candidate received a clear explanation of collection and use under India's DPDP framework?
- Access: Which people can view transcripts, scores and derived outputs?
- Anonymisation: Can leaders review patterns without exposing unnecessary personal information?
- Human review: Where must a recruiter or manager make the final decision?
- Retention: When will raw recordings, transcripts and scores be deleted or archived?
- Fairness: How will the organisation test outcomes across relevant candidate groups?
A useful maturity check is whether the company can explain the data source, decision purpose, owner, limitation and appeal route for every important output. If it can't, adding more automation will increase risk faster than insight.
Key Takeaways and Your First Step
Use this checklist with your HR or leadership team this week. The aim isn't to launch a large programme. It is to make one workforce decision more disciplined.
- Audit your records: Review the HRIS, ATS and payroll for completeness, consistent field definitions and one employee identifier that can connect the systems.
- Choose one decision: Select a live question, such as upcoming hiring volume or frontline attrition, and agree on the single metric that will guide the discussion.
- Capture structured interview evidence: Pilot a structured, AI-driven interview process for your next ten hires, then connect competency evidence to later quality-of-hire review without treating the model as an automatic decision-maker.
- Write a governance note: Keep it to one page. Cover candidate consent, access permissions, data retention, human review and the process for correcting inaccurate records.
The order matters. Clean data without a decision becomes administration. A metric without an owner becomes a recurring slide. A predictive model without governance can create false confidence and unfair outcomes.
HR analytics is working when one leader changes one action because the evidence made the better choice clearer. That might mean moving a hiring approval, reviewing a compensation band, supporting a manager or changing a workforce plan. Start with that single shift, measure what happens and earn the right to expand.
Career Central provides AI-driven phone screening, first-round interviews and coding assessments for organisations building cleaner, more consistent hiring data. Visit Career Central to explore how structured interview evidence can become the first reliable input in your HR analytics stack.