India's overall attrition rate fell to 16.2% in 2025, down from 17.7% in 2024 and 18.7% in 2023, according to Aon's annual salary increase and turnover survey reporting. That looks like a retention win. It may not be one.
The harder reading is that lower attrition can coexist with more involuntary exits, restructuring, automation, weaker external hiring, and a different mix of people entering the workforce. Recent India-focused reporting placed involuntary attrition at 4.6%, while also pointing to pressure among blue-collar and early-career groups, as summarised in industry reporting on India's changing talent mix. A CHRO should therefore ask a sharper question than “How do we reduce attrition?” The question is, which people are leaving, why are they leaving, and who decided the employment relationship should end?
Table of Contents
- What Attrition in HR Actually Means
- Why Attrition Matters More Than Turnover Headlines
- The Three Types of Attrition HR Teams Confuse
- Root Causes and What Your Data Is Telling You
- Sector Benchmarks and What a Good Number Looks Like
- How Better Screening and AI Interviews Cut Attrition at the Source
- A 90-Day Playbook to Reduce Attrition
- Reading the Signal Behind the Numbers
What Attrition in HR Actually Means
Attrition in HR measures the share of employees who leave an organisation during a defined period. HR teams usually calculate it as:
Attrition rate = separations during the period ÷ average headcount × 100
Average headcount is normally calculated from the opening and closing headcount for the period. The formula is simple. The definition behind the numerator is where organisations create confusion.
Attrition isn't automatically a synonym for every employee exit. A resignation, retirement, termination, contract ending, internal transfer, or redundancy may all appear in a broad separation report, but they don't answer the same workforce question. Attrition is most useful when it shows how the employee population is shrinking or changing, while turnover is often used more broadly for people leaving roles that the organisation may refill.
Consider a business with an average headcount of 1,000 during a year. If 100 employees leave, the total separation rate is 10%. If the organisation replaces 70 of those roles and leaves 30 vacant, the business has experienced both turnover and attrition, but the planning implications differ. Recruitment owns the replacement workload. Finance sees the reduction in workforce cost. HR must still understand why all 100 people left.
| Term | What It Counts | Typical Formula | What It Tells You |
|---|---|---|---|
| Attrition | Departures that reduce or reshape the workforce | Separations ÷ average headcount × 100 | Whether the employee population is contracting or losing specific capabilities |
| Turnover | A broader view of employees leaving and roles being replaced | Departures or replacements ÷ average headcount × 100 | The hiring and workforce movement burden |
| Exits | Every separation event recorded by HR | Count of separation events | The raw volume requiring classification |
Practical rule: Never celebrate a lower attrition rate until you've separated voluntary, involuntary, early-tenure, and regrettable exits.
A falling number can reflect genuine attachment, but it can also reflect frozen hiring, lower labour-market mobility, restructuring, or a larger share of employer-initiated exits. The metric is valuable only when HR leaders know what moved inside it.
Why Attrition Matters More Than Turnover Headlines
Turnover headlines often sound operational. Attrition is strategic because it changes capability, capacity, and the cost of keeping the business running.
The cost of replacing an employee can be substantial, particularly when the role carries customer knowledge, technical expertise, or management responsibility. A useful internal calculation starts with the employee's annual salary and adds recruitment time, onboarding, lost productivity, manager attention, and the risk that the replacement also fails to stay. The attrition cost guidance from Pin describes replacement cost as ranging from 0.5 times to 2 times annual salary, although the actual burden varies by role and seniority.
India's recent trajectory also shows why a single year-on-year comparison can mislead. Industry reporting described attrition rising from about 6% in 2020 to 20.3% in 2022, before easing into the high-teens. Aon's India survey reporting records a fall from 18.7% in 2023 to 17.7% in 2024 and 16.2% in 2025, with a projection of about 16.5% in 2026. The same report places the 2025 result roughly 490 basis points below the 2022 pandemic peak of 21.4%.
The percentage-point calculation
Finance directors should stop discussing attrition only as a rate. Convert each percentage point into people and then into operational exposure.
Suppose a company has 5,000 employees. A one percentage-point reduction represents 50 fewer departures over the measured period, assuming the headcount base remains comparable. The recoverable value then depends on the salary and replacement-cost assumptions for those roles. If the average annual salary is represented by S, a conservative replacement-cost model would be 50 × 0.5S, while a higher exposure model would be 50 × 2S.
That calculation doesn't prove a retention programme caused the saving. A hiring freeze can reduce movement just as easily as better management can. The board should therefore see the headcount effect, the voluntary share, the involuntary share, and the number of early-tenure regrettable exits beside the headline rate.
A lower rate is only good news when the organisation can explain the composition of the decline.
The Three Types of Attrition HR Teams Confuse
HR teams often damage their own analysis by averaging incompatible exits into one flattering KPI. Voluntary, involuntary, and functional attrition require different owners, interventions, and interpretations.
Voluntary attrition occurs when the employee chooses to leave. Resignations are the clearest example. Manager behaviour, career development, compensation, workload, role design, and hiring expectations can influence the outcome.
Involuntary attrition occurs when the organisation initiates the separation. It includes performance exits, non-confirmations, restructuring, and redundancy decisions. Recent India-focused reporting noted involuntary attrition at 4.6% amid restructuring and automation, as covered in reporting on talent retention and changing exit patterns. That number deserves its own line in the board pack. It shouldn't be hidden inside an overall decline.
Functional attrition is the planned departure of employees whose performance, skills, or role fit no longer serves the organisation. It can be healthy when leaders make deliberate decisions about capability. It becomes damaging when poor hiring decisions, weak onboarding, or unclear performance standards cause suitable employees to be labelled as mismatched.
| Type | Primary Driver | Who Controls It | Healthy Range | Common Mistake |
|---|---|---|---|---|
| Voluntary | Employee choice and workplace experience | Managers, HR, rewards, talent leaders | Set against role and sector context | Treating every resignation as preventable |
| Involuntary | Employer decision, restructuring, or performance action | Business leaders and HR | Set against workforce strategy | Presenting employer-led exits as retention success |
| Functional | Deliberate capability renewal or removal of poor fit | Hiring managers and performance owners | Defined by workforce plan | Calling accidental mis-hires “healthy churn” |
The reporting rule
Report all three categories separately every quarter. Give each category its own target band, owner, and explanation.
A voluntary spike under one manager needs a different response from a restructuring wave. A high functional exit rate may mean the organisation is managing performance firmly, or it may expose weak selection. Without the split, HR cannot tell the difference.
Root Causes and What Your Data Is Telling You
Voluntary exits usually arrive with a vague label such as “better opportunity”. That label is not a diagnosis. HR should tag each departure against a practical driver and test the tag against operational evidence.
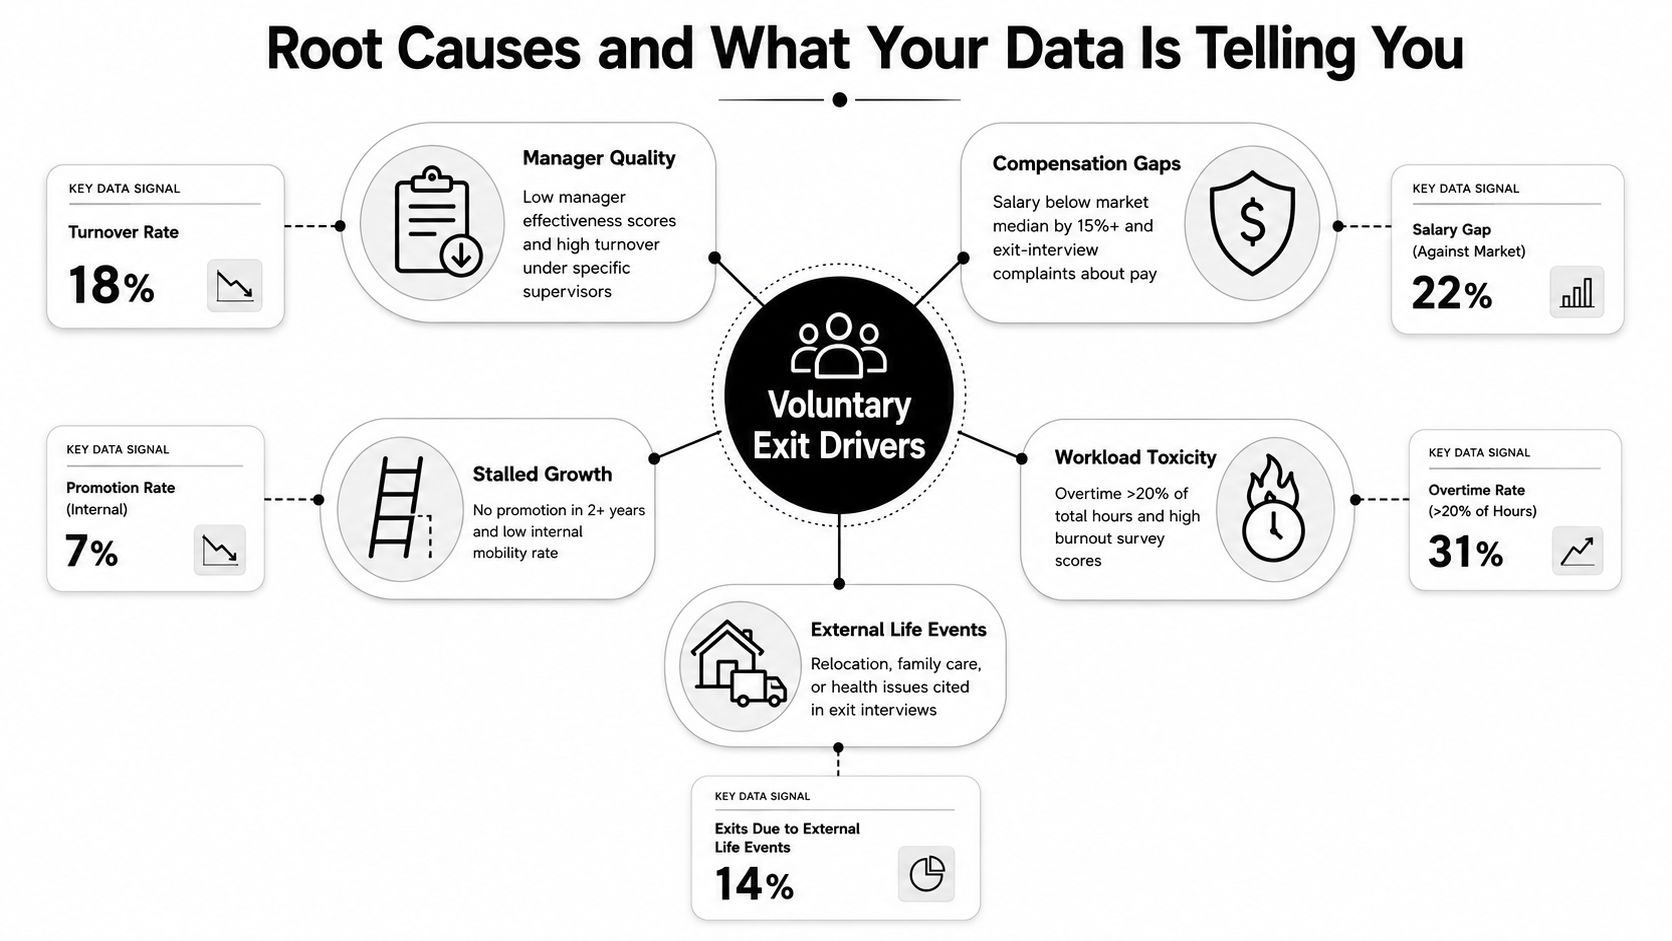
Five signals worth tracking
Manager quality: Look for clusters of short-tenure exits under particular supervisors, falling manager-effectiveness scores, and exit comments about development or support. If several capable employees leave the same team, don't blame the labour market first. Review the manager's hiring, onboarding, one-to-one, and feedback practices.
Compensation gaps: Compare accepted external offers with internal salary bands, pay-position data, and counter-offer outcomes. Repeated complaints about pay matter most when they appear alongside evidence that employees are moving to better-paid competitors.
Stalled growth: Examine promotion movement, internal applications, development-plan completion, and tenure concentration. Employees who see no credible next role often leave before HR records the problem as a retention risk.
Workload toxicity: Review overtime, absence, unused leave, rota stability, and pulse-survey responses about workload. A team can have reasonable engagement scores while losing people who carry the heaviest operational load.
External life events: Relocation, family care, health concerns, and education decisions may sit outside the employer's control. Those exits should still be recorded accurately, because cohort patterns can reveal whether a policy or location is making retention harder.
The exit-tagging checklist
Ask the HRBP or exit interviewer to record:
- Was the exit voluntary or employer initiated?
- Did the employee receive another offer?
- Was compensation a primary, secondary, or absent factor?
- Was a manager, career, workload, location, or life event involved?
- Did the employee leave during the first 90 days?
- Would the organisation rehire this person?
- Which hiring or onboarding signal should have predicted the mismatch?
Your screening process should use the same competencies and risk indicators. Guidance on candidate assessment tools is useful here because a retention dashboard is only as strong as the selection evidence feeding it.
Sector Benchmarks and What a Good Number Looks Like
A falling attrition rate is not automatically a retention win. Hiring mix, involuntary exits, and workforce growth can lower the headline while scarce-skill teams continue losing people. India's benchmarks vary by sector, role family, employment model, and labour intensity, so HR should compare like with like.
An India-focused industry summary reported voluntary attrition averaging 18% to 22% across industries in 2023 and 2024. Its sector ranges included 24% to 28% in IT and tech services, 18% to 22% in BFSI, 20% to 25% in FMCG and retail, and 10% to 14% in manufacturing, based on India-specific industry reporting on attrition and workforce planning.
Mercer's India findings show why one sector average cannot define a good number. Voluntary attrition ranged from 8.2% in automotive to 13.6% in agriculture and chemicals in 2024, according to HR Katha's summary of the findings.
| Sector | White-collar range | Blue-collar or frontline range | Notes |
|---|---|---|---|
| IT and tech services | High-teens in many role groups | Not directly comparable | Fresher, project, and scarce-skill cohorts can behave very differently |
| BFSI | Around the reported sector band | Retail banking and agency roles may differ | Separate branch, sales, operations, and specialist populations |
| FMCG and retail | Commercial and corporate roles vary | Frontline sales and store roles can be higher | Contractor and location effects can distort the total |
| Manufacturing | Engineering and specialist roles may be lower | Shopfloor populations require separate tracking | Absence, shift patterns, and local labour supply matter |
| Automotive | Specialist and engineering roles vary | Supplier-line roles may show different churn | Track plant, supplier, and skill family separately |
Treat the table as context, not a target. Build a peer band using workforce mix, then split results by sector, role, location, tenure, employment type, and manager. Check whether a lower rate reflects stronger selection, more involuntary exits, or fewer hires into volatile roles.
A stable enterprise average can hide severe loss in a scarce-skill group. Benchmark the job families that threaten delivery, and trace the result back to hiring volume, screening evidence, interview consistency, and early mismatch signals. The number is useful only when it shows where selection and retention decisions are failing.
How Better Screening and AI Interviews Cut Attrition at the Source
Most retention work starts after the employee has already joined. That is too late for many mis-hires.
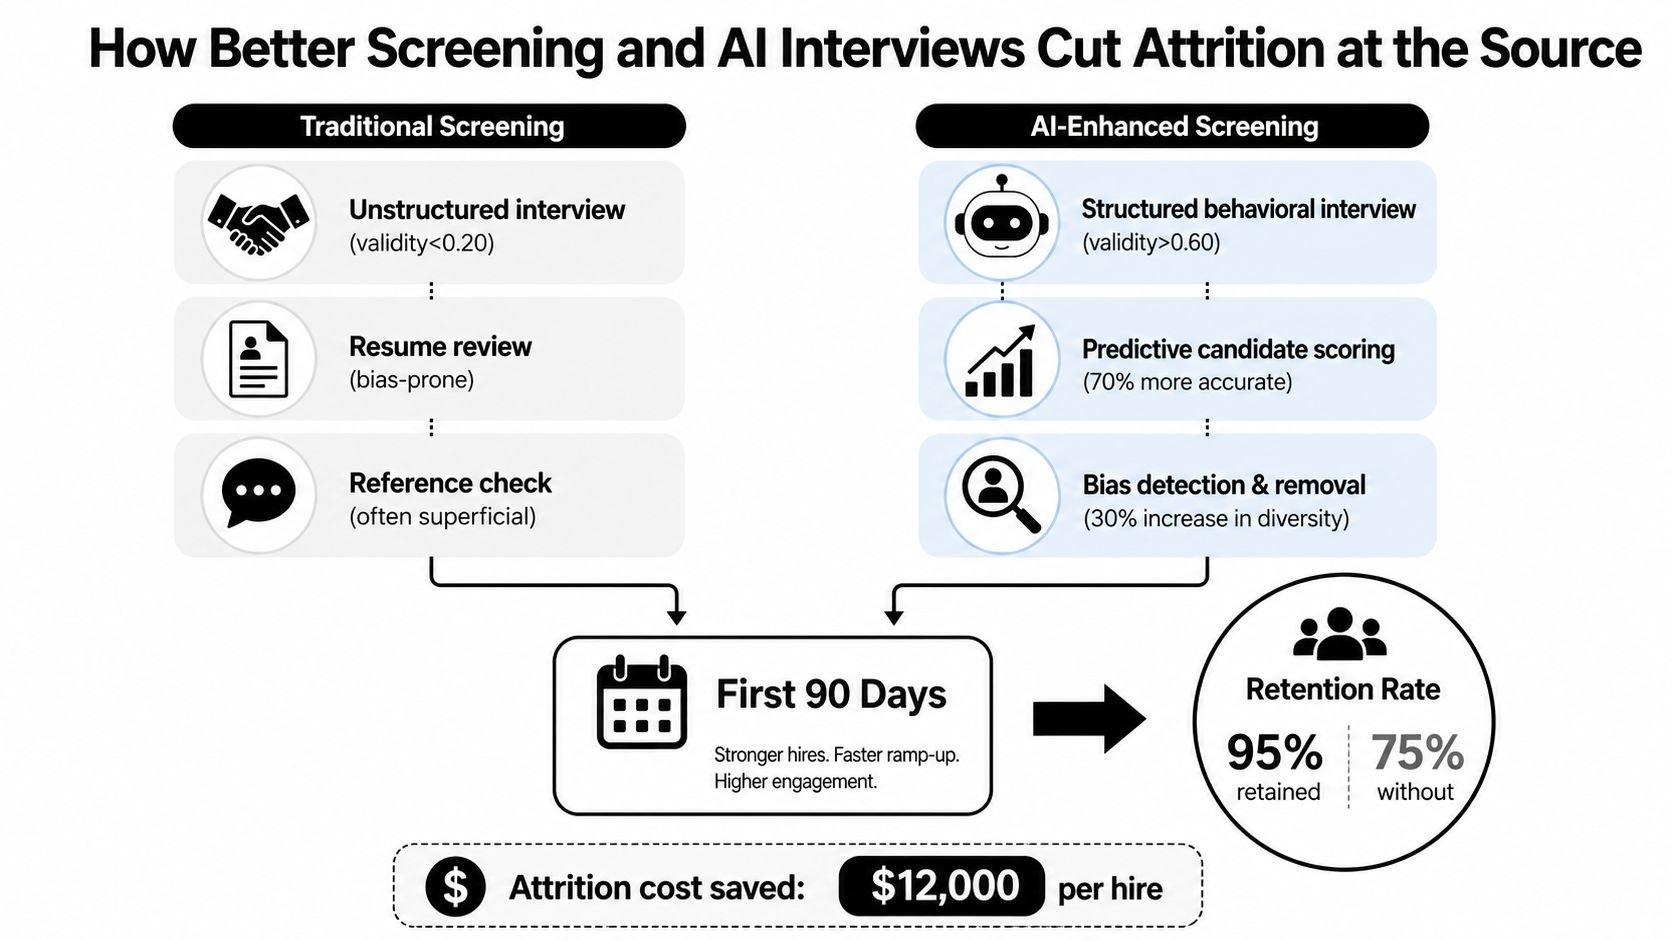
The first 90 days expose failures in job expectations, manager fit, shift practicality, commute feasibility, capability, and learning demands. Engagement surveys may identify dissatisfaction, but they rarely repair a selection decision that was wrong from the beginning.
Traditional screening fails in predictable ways. Recruiters skim CVs against keywords, interviewers improvise questions, panels reward confidence, and reference checks become polite confirmation exercises. The result is a candidate who performs well in an interview but doesn't match the work.
Make selection evidence consistent
A stronger process combines structured interviews, competency-mapped scorecards, job previews, and reference evidence. Every candidate should face the same core questions, receive the same competency definitions, and be evaluated against observable behaviours rather than personal similarity to the interviewer.
AI can help with consistency, provided the employer validates the system rather than accepting a vendor's claims. It can organise interview evidence, identify missing competencies, surface contradictory answers, and compare candidate responses with role requirements. It should support human decisions, not make opaque employment decisions without review.
For an IT services role, the scorecard might test problem solving, learning behaviour, client communication, project discipline, and willingness to work within the actual delivery model. For a BPO role, screening should make shift patterns, customer intensity, commute demands, and attendance expectations explicit before the offer. A candidate who rejects those conditions early is not a failed applicant. They are a prevented early exit.
Selection principle: If the job preview would change a candidate's decision, show it before the offer, not after joining.
Use AI interview as a service as a process category to evaluate, not as a substitute for governance. Vendor selection should cover:
- Validation evidence: Ask whether the assessment predicts role performance and early-tenure retention for comparable jobs.
- Bias auditing: Review outcomes by relevant demographic groups and test whether language, accent, disability, or access conditions distort scoring.
- Human oversight: Require recruiter and hiring-manager review, clear escalation routes, and documented overrides.
- Integration: Connect interview evidence with the ATS, HRIS, onboarding milestones, and exit data.
- Candidate experience: Explain how assessments work, what is evaluated, and how candidates can request support.
Better screening won't remove every resignation. It will reduce the avoidable exits created by unrealistic expectations and weak role fit. That is a more durable intervention than asking a departing employee why the organisation disappointed them.
A 90-Day Playbook to Reduce Attrition
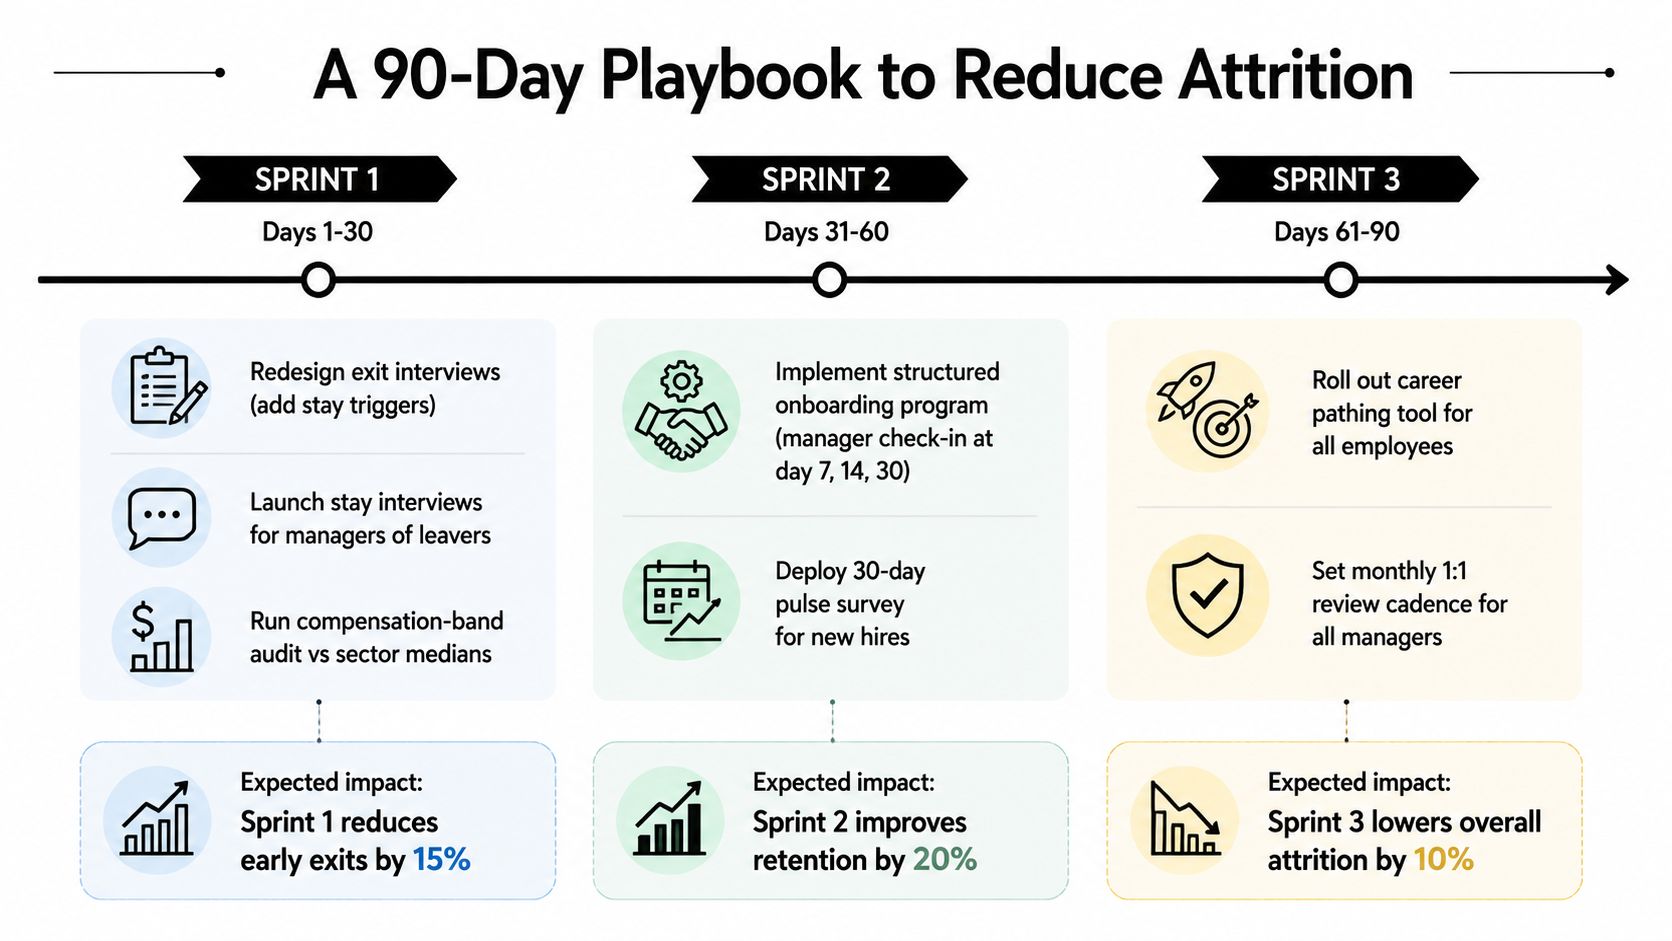
A useful attrition programme needs named owners, visible deliverables, and a measurement rhythm. The following plan gives the CHRO, talent acquisition lead, and HRBPs work they can start immediately.
Days 1 to 30, establish the facts
The CHRO owns the definition and reporting standard. Separate voluntary, involuntary, functional, regrettable, early-tenure, frontline, contractor, fresher, and lateral exits in the dashboard. The HRBP redesigns exit interviews so “better opportunity” becomes a tagged reason with evidence.
Managers of teams with recent leavers should run stay interviews with current employees. Ask what might make them leave, which part of the role creates friction, and what development opportunity they want next. The reward lead or HRBP should audit salary bands against relevant sector peers, while the TA lead checks whether job descriptions describe the actual work.
Deliverables include a clean attrition definition, a root-cause taxonomy, manager-level reporting, and a list of the highest-risk teams.
Days 31 to 60, fix the upstream system
The TA lead should revise job descriptions and role scorecards around competencies, work conditions, and realistic outcomes. Pilot structured interviews with the hiring managers responsible for the largest volume of recruitment. Add a 90-day onboarding review at clear milestones, with the manager accountable for role clarity, training, access, and feedback.
The CHRO should connect manager accountability to regrettable attrition, not to a simplistic demand for zero exits. A manager shouldn't be punished for a planned performance exit, but repeated regrettable losses and weak onboarding evidence require action.
Days 61 to 90, make measurement routine
The HR analytics owner reports the voluntary and involuntary split monthly, benchmarks sectors quarterly, and tags every exit. The HRBP maintains a retention-risk view for high performers and scarce-skill employees, with documented interventions and outcomes.
Use background verification processes to strengthen pre-employment diligence, but don't mistake verification for fit assessment. Verification confirms history. Structured selection determines whether the candidate can and will do the work you need.
Reading the Signal Behind the Numbers
India's headline attrition decline is real, but it does not prove stronger retention. Business Today's analysis of the 2025 figure notes that lower attrition can reflect cooling hiring demand and slower external pipelines. Employees may be staying because fewer alternatives are available.
Before declaring success, a CHRO should ask:
- What share of exits was involuntary?
- What is the regrettable-attrition rate among employees with less than 12 months' service?
- Which two managers account for the largest share of regrettable exits?
| Metric | Headline Says | Signal to Test |
|---|---|---|
| Overall attrition | Fewer people left | Workforce stability may have improved, or mobility may be constrained |
| Voluntary attrition | Employees chose to stay | Employees may be waiting for better market conditions |
| Involuntary attrition | Workforce cost is controlled | Restructuring, automation, or selection problems may be increasing |
| Early-tenure attrition | New-hire churn is manageable | Screening, job previews, or onboarding may be failing |
| Manager-level regrettable exits | The company average is healthy | A few teams may be losing critical talent |
Treat attrition as a quality-of-hiring and quality-of-management metric. Falling exits can signal a better hiring mix, fewer external opportunities, or more involuntary departures. The response starts upstream: tighten screening, test role fit in interviews, and give candidates an accurate job preview. Engagement surveys cannot repair a selection decision that was wrong at the start.
Career Central helps organisations run AI-driven phone screening, first-round interviews, and coding assessments that connect hiring evidence to role fit. Visit Career Central to strengthen screening before avoidable attrition reaches the first 90 days.